


Valuations, risk metrics and xVAs within seconds


Runs on a laptop or PC
All calculations are performed on the user’s machine (“locally”). The computational challenges created by derivatives (e.g. for credit risks, regulatory metrics, …) are tackled by numerous innovative algorithms aiming at speed and small memory footprint, whilst not compromising the modeling. The benefits of this “run local” approach are:No reliance on Internet, servers, platforms, clusters, VPN, firewalls, …Instant availability; anytimeNo sharing of sensitive data: portfolios, transactions, counterparties, collateral agreements and other confidential information remain on the user’s machineNo pay-per-use (a valid license allows unlimited usage)Eco-friendly: no additional hardware or power costs other than user’s PC/laptopReduced overall IT costs
Excel-based Interface
Our Excel-based interface enables a simple and intuitive usage, be it portfolio and trades management, counterparty and CSAs definitions or market data analysis and visualization. Hosting the interface within Excel© (via a VSTO add-in) enables the use of Excel’s built-in features, in addition toeasy filtering and selection (trades, counterparties, …)results readily available for reporting (including graphs)simple access to what-if scenarios (trades transfers, terminations or inceptions; changes of CSA details; …)efficient storage and manipulation: a portfolio -and its dependencies- consists of an Excel Workbook, enabling multiple portfolios, trials, scratchpads, change analysis (e.g. before & after), sharing across usersstandard facilities such as import / export (portfolio, counterparties, market data), trade management, …
xVAs, in-house, in seconds.
-
Modeling
Modeling meets market standards (dual yield curves, cross-currency basis swaps, CDS & funding, inflation, volatilities, …).
Simulations use widely-adopted models (e.g. Hull & White, Jarrow & Yildirim, etc.)
-
Transaction Types
Various types of transactions are supported: vanillas, amortizers, cross-currency swaps, swaptions (cash or physical settled), CMS (plain, caps or floors), inflation-linked (zero-coupon inflation swaps, notional-indexed, …).
-
Metrics
In addition to mark-to-market and hedges, the available metrics are the usual xVAs (CVA, DVA, FVA), time-line-based exposures (EPEs, ENEs, EEs and PFEs) as well as capital-based measures (RWA & Leverage Ratio, SACCR / IMM).
-
Intelligent Dependency
Intelligent dependencies automatically filter simulation requirements, reducing simulation time.
Simulation data automatically derived from market data universe.
-
Transaction Specs
Trades can be edited (via simple GUIs), constructed or imported. They can contain any number of “legs” -fixed “leg”, float “leg”, etc.
Trades’ projected cashflows and necessary resets are easily obtained.
-
"What-If" Scenarios
Scenarios of trades’ inceptions, transfers or terminations, all calculated within a single run. Collateral agreements specificities modifiable to assess impact.
View results as a “before & after” or net changes.
-
Speed & Accuracy
Simulations are fast without modeling or analytical compromise. Further accelerators available (variance reduction, multithreading, …).
Simulations results’ confidence intervals reported.
-
Granularity
Easy access to trades’ marginal contributions to xVAs (sensitivities to trades’ notional).
Hedges can be viewed at different granularity levels: trade, book, counterparty or whole portfolio.
-
Versatile Point-of-View
Results can be viewed from the user’s own point of view, looking at each counterparty, or
from all user’s counterparties’ point of view, each looking at the user.

Use Cases
Trade Analysis
A new trade? Transferring / assigning trade(s)? The question that often arises is “with whom should I trade?” Transactions’ ultimate costs or benefits will depend on the then-prevailing set of trades with each counterparty and their respective collateral agreements. Any change to those sets will impact not only mark-to-markets but funding costs (e.g. FVA), credit exposures, capital charges, etc. of the chosen counterparty.QxCell offers the ability to perform easily an accurate and complete analysis in such circumstances, meaning that users no longer need to only rely on external (3rd party or counterparties) valuations, whether for mark-to-market or adjustments (xVAs) or even capital charges.A simple “what if” scenario (consisting of a trade (or more) being done with, or assigned to, different counterparties) can show the impacts on various relevant metrics (read costs or benefits) for each contemplated counterparty, all calculated in a single run.The ability to perform such analysis in-house has multiple benefits: less dependence on counterparties and greater independence, better understanding and management of transactions, portfolios and treasury, also resulting in greater negotiating power -and reduced costs.Trade-Level Contributions to xVAs
The calculation of valuation adjustments (xVAs) is a highly complex, potentially lengthy and certainly resource-intensive process.Calculating the individual contributions of each of hundreds of transactions to such adjustments can therefore appear as a daunting task, since it boils down to the calculation of a very large number of metrics (being the number of transactions multiplied by the number of desired metrics).If approached naïvely, that is by “brutally” repeating calculation runs for each trade, this could take hours -ignoring all the data manipulation required.Taking advantage of the flexibility and capabilities of its calculation engine, QxCell is able to efficiently calculate all those individual trades’ contributions, that is, within a single calculation run, by simply clicking on a button.Such analysis can be helpful in understanding which trades contribute the most to this or that adjustment. Such measures are also being increasingly relevant to / requested by auditors. Renegotiating your CSA
QxCell gives the ability to measure the impact of each term of a collateral agreement, a key-information when (re)negotiating such agreement.Indeed, the user has the ability to create multiple counterparties on-the-fly; here, each new “dummy” counterparty would represent a potential change in the terms of a contemplated collateral agreement (e.g. where a threshold is changed, or a floor on the collateral interests is added, etc.).By applying a simple “what if“ scenario where all the trades of the original (base) counterparty are assigned to each “dummy” one, the user can obtain accurate and fast assessments of the relevance (importance) to this or that term. Those impacts can be assessed within a single run.Easy access to such information allows to gain a better understanding (and thus negotiating power) of what is at stake.Trust… but verify
QxCell empowers users by making market-standards analytics tools available, from simple mark-to-market to hedges to the calculation of valuation adjustments and capital metrics.Those metrics can be obtained quickly, anytime, be viewed from the point of view of each counterparty (or that of the user) and come with a measure of their accuracy -for those calculated by simulations such as valuation adjustments.Users can then quickly assess differences, inconsistencies or errors vs. values given by their counterparties.By raising users’ in-house capabilities, QxCell helps decrease reliance on counterparties.Discover some of QxCell’s
User-Interface Components and Facilities
-
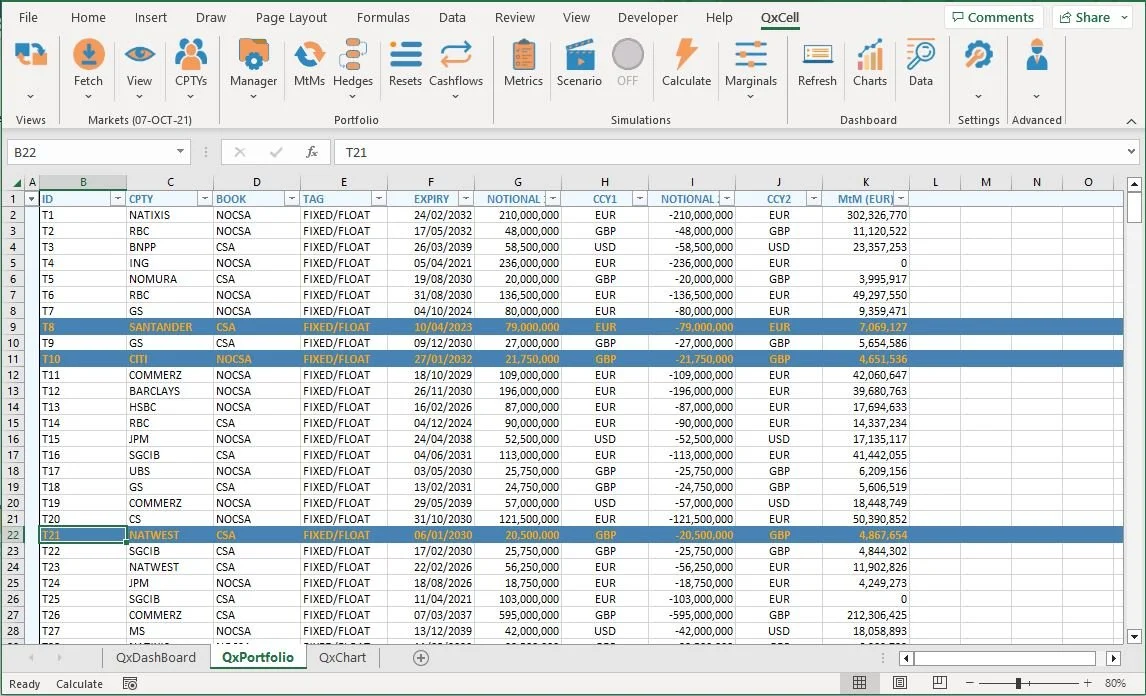
Portfolio
The Portfolio sheet, with a bird’s eye view of key trades’ particulars (ID, expiry, mark-to-market, etc).
Blue rows are trades currently “selected” -that is, candidates for scenarios or either for selection-based hedges, marginals or cashflows analysis.
One can use Excel© auto-filtering capabilities to narrow the choice, then “select” the resulting displayed trades, as above.
-
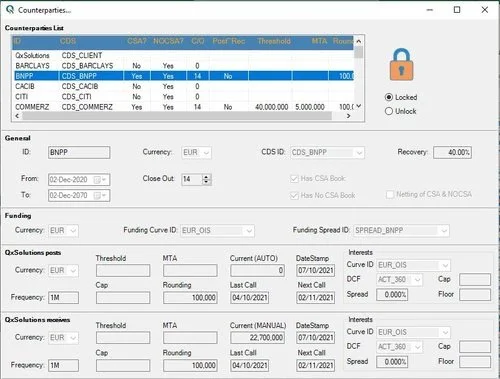
User-Friendly Counterparties Manager
View / edit your counterparties and collateral agreement details via a user-friendly pop-up window.
-
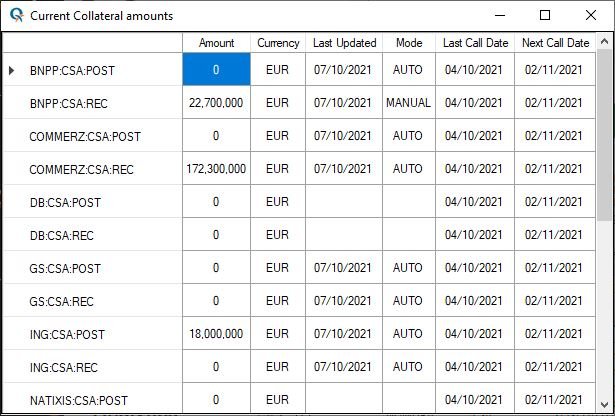
View Current Collateral Amounts
View current collateral amounts posted or received for each counterparty, update mode (manually entered, automatically “estimated” from MtMs) as well surrounding collateral anniversary dates.
-

User-Friendly Trade / Legs Editors
Trades and Legs have user-friendly GUIs, enabling easy trade entries.
-

Trades Manager
The Trades Manager allows to define / view trades made of more (or less) than the standard -vanilla- 2 legs -for instance, for a capped & floored CMS-based trade.
-
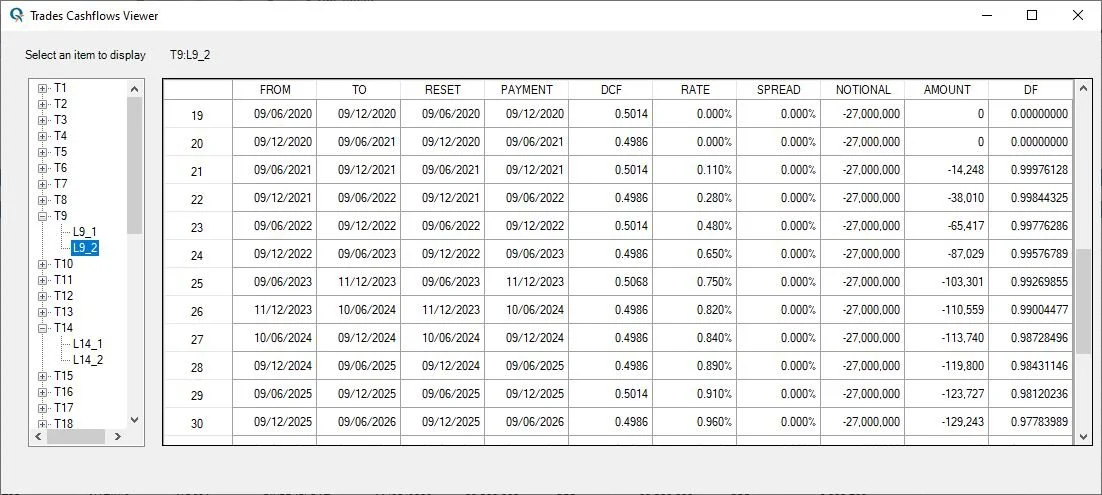
Review / Check Trades Cashflows
The left-hand pane allows to select the desired trade and leg.
The right-hand side displays information about all the selected leg’s (projected) cashflows. -
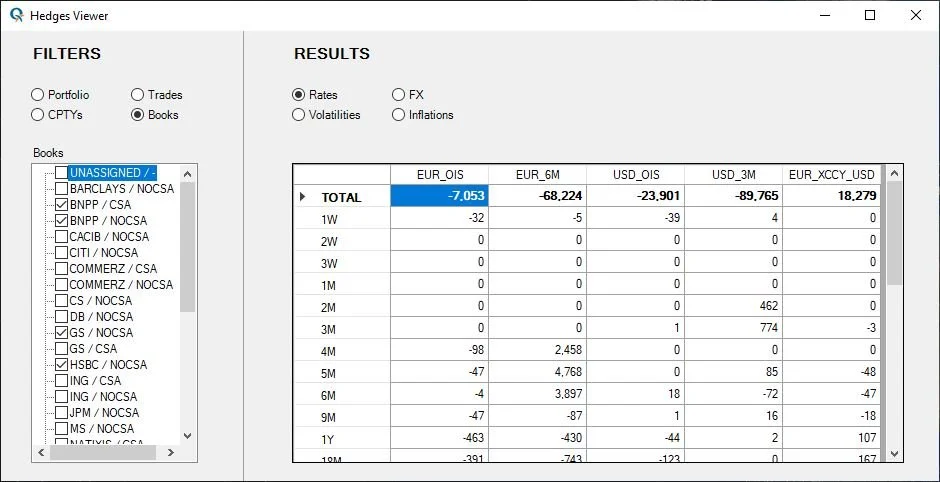
Hedges at Different Granularity Levels
The left-hand pane allows to select the desired granularity and items to display.
The right-hand side displays results for the selected category (Rates, FX, …). -
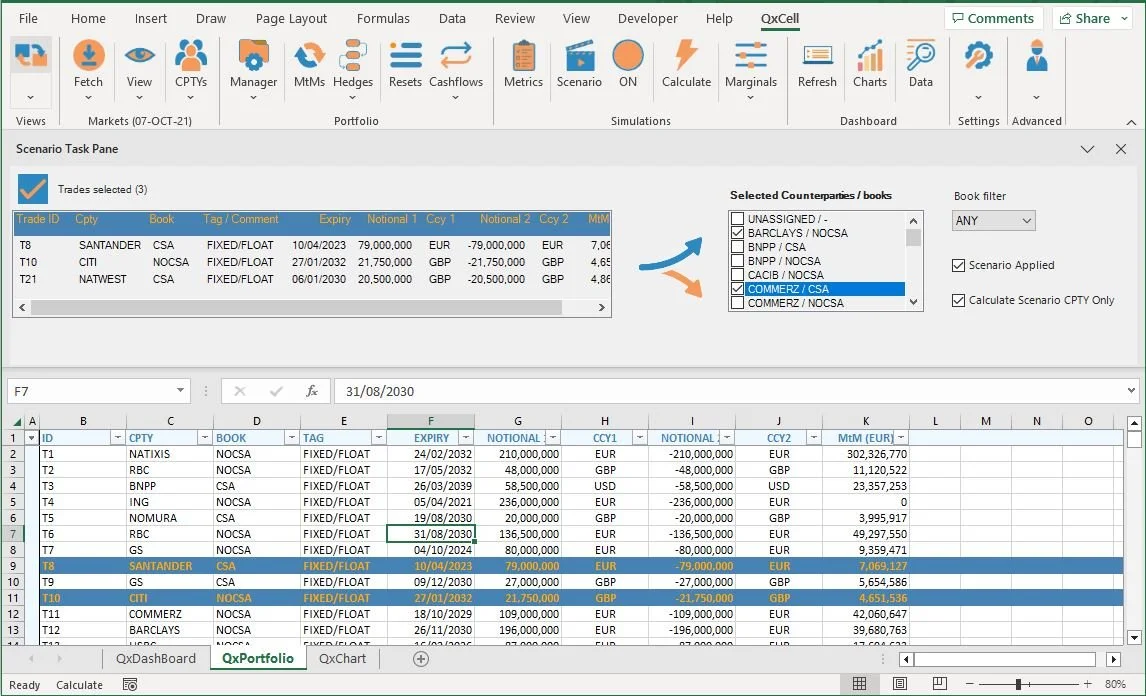
"What If" Scenario Manager
The “what if” scenario manager allows to specify to whom the “selected trades” could be assigned.
-

Marginal Trades Contributions
Contributions, per trade, to several metrics. Data can be exported to another workbook, for instance for reporting purposes.
-
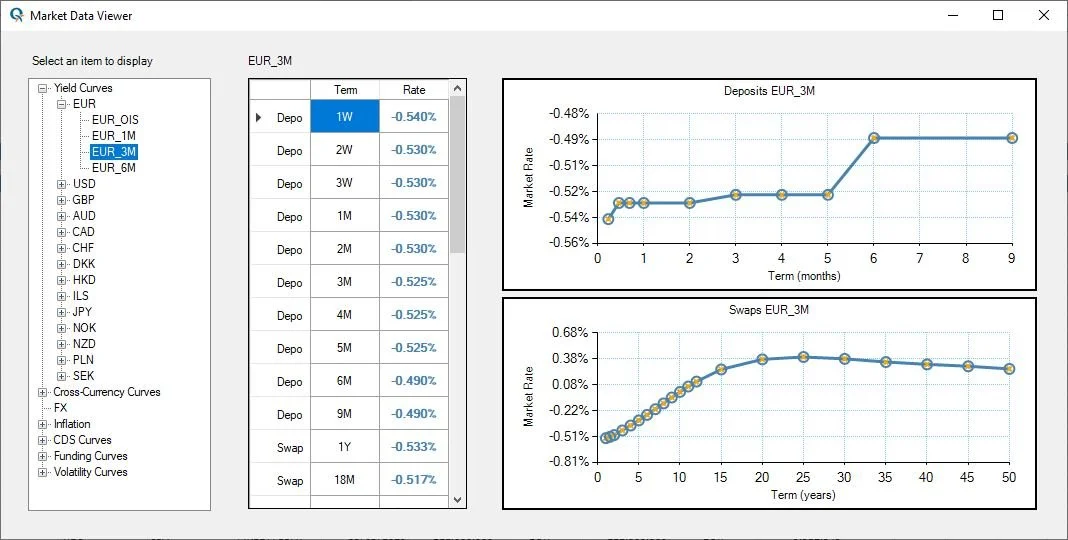
Market Data Viewer
The Market Data viewer allows to inspect and visualize all currently loaded market data components, or the simulation data derived from them.
-

Powerful Charting Tools
A chart exported through the Charts viewer, allowing to view exposures “at-a-glance”.
-
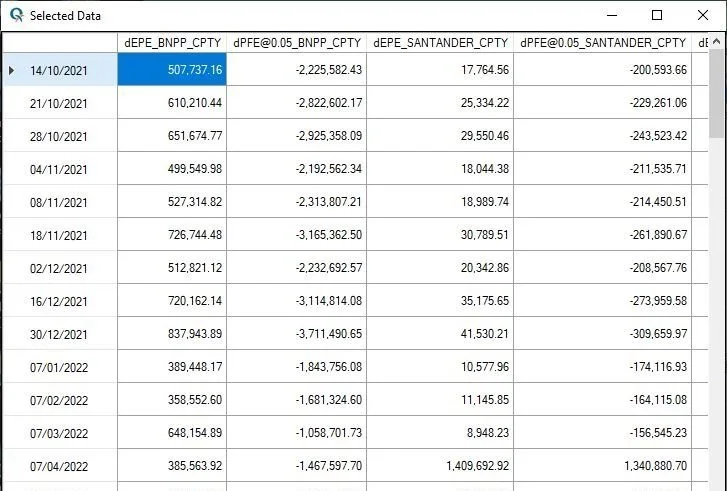
View Exposure Data-Points
Users can also view the actual underlying data-points, and copy/paste to another workbook.
Our Users
Our users currently range from consulting, advisory or audit firms, using the software to help their clients navigate through typical derivatives-related matters such as CSA renegotiations or transactions and counterparty management, to large corporate entities, aiming to gain more independence and in-house capabilities for the day-to-day management of their derivatives portfolios.
Leemax Advisory, our earliest adopter, deserve a special mention for their experience and insight into user-interfacing, especially during our development phase.